HOME > Research Activities > Research Updates >
When we discuss spectroscopy we think of light being separated into seven colors by a prism. We call the process of the light (electromagnetic wave) signal by digitalization digital spectroscopy. Here, we introduce research that measures in detail the electron temperature fluctuations (time variation) in plasma by analyzing extremely high-frequency electromagnetic waves with digital spectroscopy.
One method for measuring electron temperature fluctuations in plasma is using electromagnetic waves called “electron cyclotron emissions,” or ECE. The electrons in a plasma rotate at high speeds around magnetic lines of force, and during the rotation the ECE is radiated. In the ECE are included various electromagnetic wave frequencies, from several gigahertz to several hundred gigahertz (a gigahertz is 1,000,000,000 hertz). Those frequencies are continuous. From this continuous frequency spectrum (strength distribution of the electromagnetic wave as a function of the frequency), we can obtain the spatial distribution of the electron temperature. Further, by analyzing the time change of the continuous frequency spectrum we find the spatial distribution of the electron temperature fluctuations. (The electron temperature is fluctuating where in the plasma and at what speed.)
In order to measure the electron temperature fluctuations with high spatial resolution, it is necessary to measure the continuous frequency spectrum of the ECE and its temporal variations at high-speed. However, because the ECE frequencies are extremely high, such high-speed measurement has been considered to become extremely difficult. In the past, we measured spectra by using analog frequency filters. With this method, we could only obtain the spectrum, which is originally continuous, at discrete frequencies, and there remains the issue that the high spatial resolution cannot be obtained. This time, due to recent technical advances, we can focus on the collection of data at speeds that exceed gigahertz, and high-speed measurement of continuous spectra has become possible by utilizing digital spectroscopy. As a result of using the newest data collection technique, we are able to obtain at high speeds temporal variations of continuous frequency spectra. Moreover, we have improved a calculation program that analyzes temporal variations, and have succeeded in enhancing its speed.
In this way, due to the high-speed measurements of ECE’s continuous high-frequency spectrum and the speeding-up of the calculation programs, we have solved the earlier issues of not being able to obtain high spatial resolution, and now more so than in the past can measure at high resolutions electron temperature fluctuations. In the future, from these measurements, we will now be able to observe various phenomena which in the past we could not measure in detail. We anticipate that our understanding of high-temperature plasma will continue to deepen.
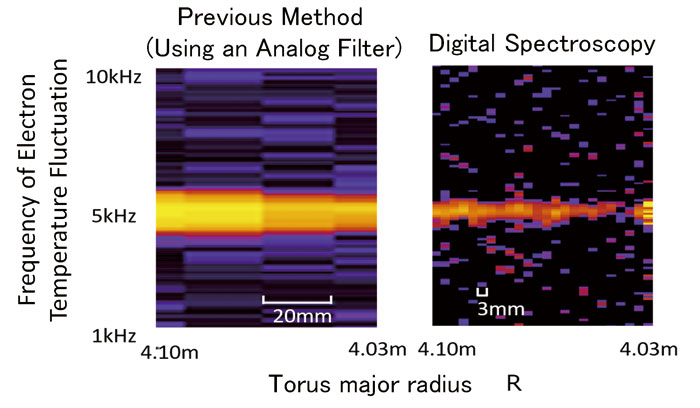
Spatial distribution of electron temperature fluctuations in a plasma.
The horizontal axis indicates spatial location; the vertical axis indicates frequency of fluctuation; and the color indicates the fluctuation’s amplitude (yellow is large). The left-hand image was obtained using the process to date (using an analog frequency filter), and the right-hand image was obtained by digital spectroscopy. The smallest unit of the images (see the white line inside the image) shows that the right image is much smaller than the left image, and by using digital spectroscopy the spatial resolution is greatly improved, and becomes a still finer image.