HOME > Research Activities > Research Updates >
In order to realize fusion energy, together with improving the performance of core plasma confined in the magnetic field cage it also is necessary to understand the behavior of edge plasma. By touching the device wall (the heat-resistant part called the divertor plate; below as “wall”), edge plasma causes various phenomena to occur. In order to understand those phenomena, we express the various physical processes relating to edge plasma numerically. Based upon those data, we perform simulations, and comparative research with experimental results is indispensable. Here, we will introduce recent research results.
In edge plasma, in addition to plasma, “neutral particles” too are important. The temperature of a core plasma reaches several tens of millions degrees, and while the plasma moves along the magnetic field lines from the core confinement region toward the wall, the temperature falls to several tens of thousands degrees. The wall temperature is at its highest several thousands degrees. When the plasma touches the wall it loses the plus/minus electrical charge, and becomes “neutral particles.” Neutral particles bounce off the device wall and return to the plasma, and other particles enter into the wall. The neutral particles that returned to the plasma are ionized by the collision with the plasma (the neutral particles are separated into ions and electrons) and again become plasma. The neutral particles that entered the wall behave variously; some move about inside the wall and some remain in one place. At any moment (the wall temperature changes, or neutral particles strike) there also are neutrals that are released from the wall and move toward the plasma. This type of “particle circulation” provides important influences for the improvement of the plasma performance and plasma confinement.
Further, “impurities,” too, play important roles in edge plasma. When a plasma strikes the wall, elements such as carbon are expelled. When those elements enter a plasma they become impurities. Because impurities absorb energy from the plasma and the energy is emitted as electromagnetic waves, the plasma cools. On the other hand, impurities in the edge region cool the plasma and reduce the heat flow toward the wall, which brings a favorable effect for the wall. How impurities are distributed in an edge plasma is determined by how impurities in the plasma are carried.
In this way, the phenomena that occur in edge plasma are related to various physical processes, and are extremely complicated. At NIFS, we express these physical processes through equations, and we are developing simulation programs that will calculate those equations. Using simulations, we understand the phenomena of edge region plasma, and predict. And in order to design the future fusion reactor, we must be able to reproduce experimental results through simulations. Thus, in the Large Helical Device (LHD) we affixed diagnostic instruments that enable us to measure edge plasma in detail, and we are advancing with comparative research between experimental results and simulations. Recently, in order to measure in detail from what places in edge plasma light emerges and what wavelength light bears, we affixed additional spectrometers, which will enable us to measure more places. The wavelength that neutral particles and impurities emit differs depending on the electrical condition (charge state = how many electrons are stripped) of neutral particles and impurities. From these spectrometers, in edge plasma, we have become able to measure spatial distributions and electrical condition (charge state) of neutral particles and impurities when they emit light. As a result, we have clarified that almost all of the neutral particles that returned from the wall are being ionized by edge plasma before entering the core region. Further, we successfully achieved the spatial distribution of emitted light at each charge state. In undertaking a comparison of these experimental data and simulation results, we were able to replicate in a simulation the light emission distribution in general. We learned that that distribution was related to the structure of the magnetic field lines. In the future, by conducting still further detailed comparisons, we will verify in detail which parts of the equations that we are using in the simulation were correct and which were incorrect, and we will make improvements. Through this type of comparison between experiment and simulation, we will raise predictive performance, which will be helpful in the design of the future fusion reactor.
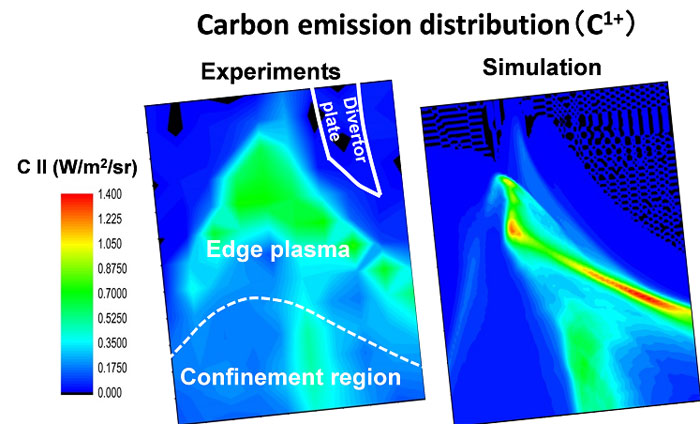
The spatial distribution of light emission of (carbon) impurities in the edge region of LHD.
Left: Experimental data that was measured by a newly installed spectrometer.
Right: Simulation results based upon equations.
By comparing both images, we can see that the general shape of the light emission distribution was reproduced in the simulation.